

HOUSE prices in Oldham have seen the second biggest rise in the whole of the UK, latest figures reveal.
Oldham homes have gone up a whopping 15.7 per cent since the first lockdown, the second highest increase in the UK, according to Land Registry data.
Only homes in Liverpool saw a steeper rise in prices, with houses up 16.7 per cent over the same period.
House prices in Burnley saw the biggest boost after Oldham, with an increase of 15.2 per cent, followed by homes in Blackburn which soared by 14.2 per cent.
In January, the borough's house prices however increased more than the average for the North West by 2.7 per cent.
Meanwhile in Manchester houses went up 13 per cent, beating homes in London which only increased by 3.7 per cent since March 2020.
Over the last year, the average sale price of property in Oldham rose by £20,000 – putting the area fourth among the North West’s 43 local authorities for annual growth.
In January, the borough's house prices however increased more than the average for the North West by 2.7 per cent.
That month the average Oldham house price was £161,610, Land Registry figures show, a 2.7 per cent increase on the previous month.
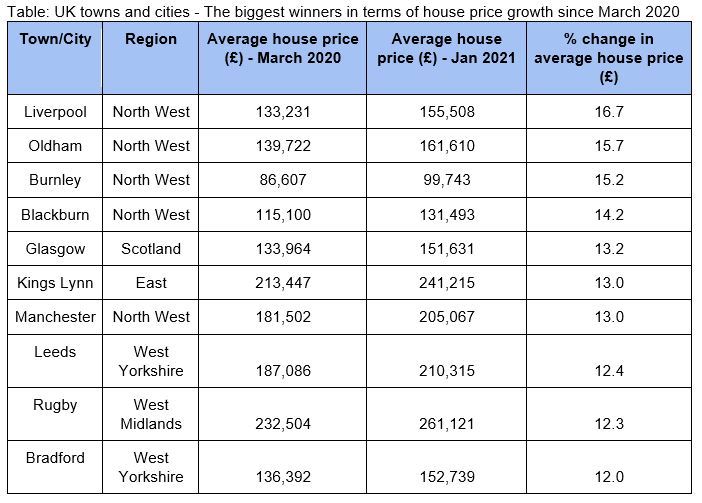
Biggest property value winners. Picture: Andrews Property Group
David Westgate, group chief executive at Andrews Property Group, said: “The stamp duty holiday introduced in July has smoothed the bumps and helped fuel house price growth, turbo-charging the property market in the second half of 2020. We saw a buyer frenzy, with people looking to take advantage of stamp duty savings up to £15,000. That, coupled with continued low stock in many areas, has supported prices.”
Owners of semi-detached houses in Oldham saw the biggest improvement in property prices at the start of this year.
In January, semi-detached properties in the borough increased by 3 per cent, to £181,815 on average and over the last year, prices rose by 14.5 per cent.
Detached properties were up 2.4 per cent monthly and 15.1 per cent annually, terraced houses were up 2.6 per cent monthly and 14.4 per cent annually and flats were up 1.6 per cent monthly and up 9.5 per cent annually.
Meanwhile, first-time buyers in Oldham spent an average of £145,000 on their property – £18,000 more than a year ago, and £40,000 more than in December 2015.
HOUSE PRICES: The average Oldham house price in January was £161,610, Land Registry figures show – a 2.7 per cent increase on December.
By comparison, former owner-occupiers paid £180,000 on average in January – 23.9 per cent more than first-time buyers.
Oldham buyers also paid 12.3 per cent less than the average price in the North West (£184,000) in January for a property in the borough.
Across the North West, property prices are low compared to those across the UK, where the average cost £249,000.
The most expensive properties in the North West were in Trafford – £331,000 on average, and twice as much as in Oldham. Trafford properties cost 3.3 times as much as homes in Burnley (£100,000 average), at the other end of the scale.
The highest property prices across the UK were meanwhile in Kensington and Chelsea, where the average January sale price of £1.3 million could buy 14 properties in Blaenau Gwent (average £93,000).


Comments: Our rules
We want our comments to be a lively and valuable part of our community - a place where readers can debate and engage with the most important local issues. The ability to comment on our stories is a privilege, not a right, however, and that privilege may be withdrawn if it is abused or misused.
Please report any comments that break our rules.
Read the rules here