

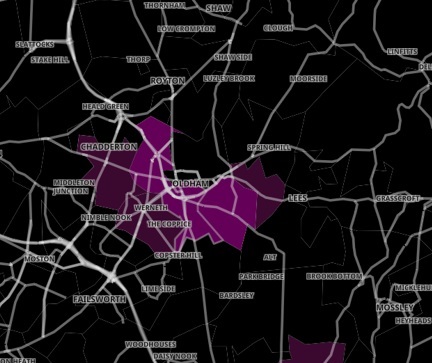
AN interactive map illustrating coronavirus infection rates across the UK shows parts of Oldham are much higher than the national average – with Saddleworth recording the highest in the borough.
The seven-day rate of Covid-19 cases per 100,000 people in Britain in the week up to December 30 stood at 1,596.9 but there are many districts in the borough that are above this.
The Oldham Town North area's rate was 1,924.1 after 148 cases were recorded in the week up to that date, a 118 per cent increase.
The Oldham Town South part was much lower at 853.2 following 76 cases being logged, a 69 per cent jump.
Werneth's rate stood slightly higher at 961.5.
Other rates recorded on December 30 included Failsworth East (2,267.4), Derker (2,234.3), Waterhead (2,211.0), Alt (1,989.3), Lime Side and Garden Suburb (1,957.0), Chadderton North (1,952.4) and Chadderton Central (1,698.0).
In Royton, the North area (2,564.6) has the largest rate followed by the South East (2,482.5), the South West section (2,288.9) and Royton East and Cowlishaw (2,004.6).
Further away from the town centre, Lees and Hey's rate of 2,274.7 was above Moorside and Sholver (2,234.9), Shaw and Crompton (2,095.9) and Clough and Shaw Side (2,055.3).
Oldham on the interactive map
But in Saddleworth the highest coronavirus infection rates were recorded.
Greenfield and Uppermill had the largest rate (2,613.4) after 159 cases were logged, an 87 per cent rise.
The New Delph, Dobcross and Austerlands area (2,611.8), Springhead and Grasscroft area (2,523.6), Diggle, Delph and Denshaw (2,201.8) all showed large infections rate.
The interactive map is colour coded with the highest rates marked in darker colours. Many areas of the borough are coloured in black.
Meanwhile, figures released across the UK on Tuesday found 218,724 cases were recorded.
A total of 48 deaths were reported in which the deceased tested positive in the previous 28 days.


Comments: Our rules
We want our comments to be a lively and valuable part of our community - a place where readers can debate and engage with the most important local issues. The ability to comment on our stories is a privilege, not a right, however, and that privilege may be withdrawn if it is abused or misused.
Please report any comments that break our rules.
Read the rules here